Wooly Worms Lab 10/31/17
Questions:
a. The degrees of freedom is
c. The calculated Chi Square is 40.06
d. The results for the lab are significant because it was not just chance that people found the worms that they found.
e. The green worms and darker worms had positive selection since they were able to camouflage and the
a. The degrees of freedom is
c. The calculated Chi Square is 40.06
d. The results for the lab are significant because it was not just chance that people found the worms that they found.
e. The green worms and darker worms had positive selection since they were able to camouflage and the
Species Parking Lot Lab 10/19/17
Adult Parking Lot
Click to set custom HTML
Student Parking Lot
Post Lab Questions
1. Identify the parking lot that was the most diverse. Based on your observations during the lab, explain why your
prediction in question #1 of the prelab was supported or not supported.
- The student parking lot was more diverse. I predicted this because I have seen students that have a lot of different brands for cars.
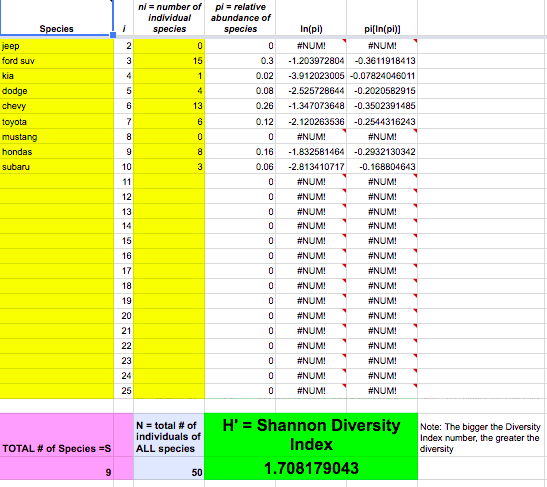
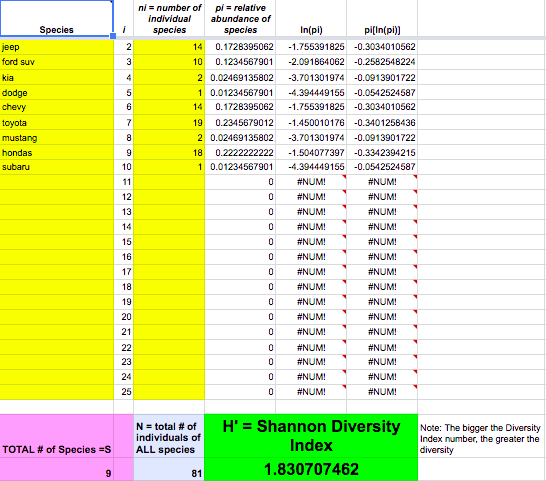
2. List the single most abundant species in each set of data, and write a plausible explanation to explain why these are
the most abundant species.
- The most abundant species in the student parking lot is the brand, Toyota. This could be due to the popularity and more affordable price of them. The most diverse species for the adult parking lot is the brand, Ford. Fords could be the most abundant species for the staff parking because they are long lasting and most likely and also not as expensive as other cars.
3. Determine the maximum and minimum values for the Shannon Diversity Index in the parking lot you surveyed.
- The Maximum value of the Shannon Diversity Index is 1.8. The minimum value of the Shannon Diversity Index is 1.7.
4. If you conducted this lab in a shopping mall parking lot, predict whether the Shannon Diversity Index would be high or
low, and how it would compare to the school parking lots.
- The Diversity index would be higher, since the school parking lots are not larger than Mall parking lots. In a mall's parking lot there is more a chance of there being different brands of cars.
5. If you conducted this lab at a new car dealership, predict whether the Shannon Diversity Index would be high or low,
and how it would compare to the school parking lots.
- If I was to conduct this experiment in a car dealership, the Diversity index would depend on what dealer I am in. A lot dealerships have different brands are more or less diverse, but others have solely one brand. Overall I believe a car dealership's index would be slightly less.
1. Identify the parking lot that was the most diverse. Based on your observations during the lab, explain why your
prediction in question #1 of the prelab was supported or not supported.
- The student parking lot was more diverse. I predicted this because I have seen students that have a lot of different brands for cars.
2. List the single most abundant species in each set of data, and write a plausible explanation to explain why these are
the most abundant species.
- The most abundant species in the student parking lot is the brand, Toyota. This could be due to the popularity and more affordable price of them. The most diverse species for the adult parking lot is the brand, Ford. Fords could be the most abundant species for the staff parking because they are long lasting and most likely and also not as expensive as other cars.
3. Determine the maximum and minimum values for the Shannon Diversity Index in the parking lot you surveyed.
- The Maximum value of the Shannon Diversity Index is 1.8. The minimum value of the Shannon Diversity Index is 1.7.
4. If you conducted this lab in a shopping mall parking lot, predict whether the Shannon Diversity Index would be high or
low, and how it would compare to the school parking lots.
- The Diversity index would be higher, since the school parking lots are not larger than Mall parking lots. In a mall's parking lot there is more a chance of there being different brands of cars.
5. If you conducted this lab at a new car dealership, predict whether the Shannon Diversity Index would be high or low,
and how it would compare to the school parking lots.
- If I was to conduct this experiment in a car dealership, the Diversity index would depend on what dealer I am in. A lot dealerships have different brands are more or less diverse, but others have solely one brand. Overall I believe a car dealership's index would be slightly less.
Diagrams 9/22/17
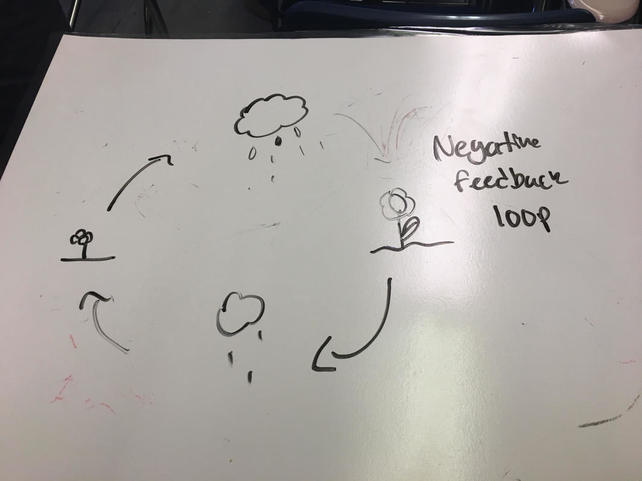
U.S. Diagrams
9/15/17
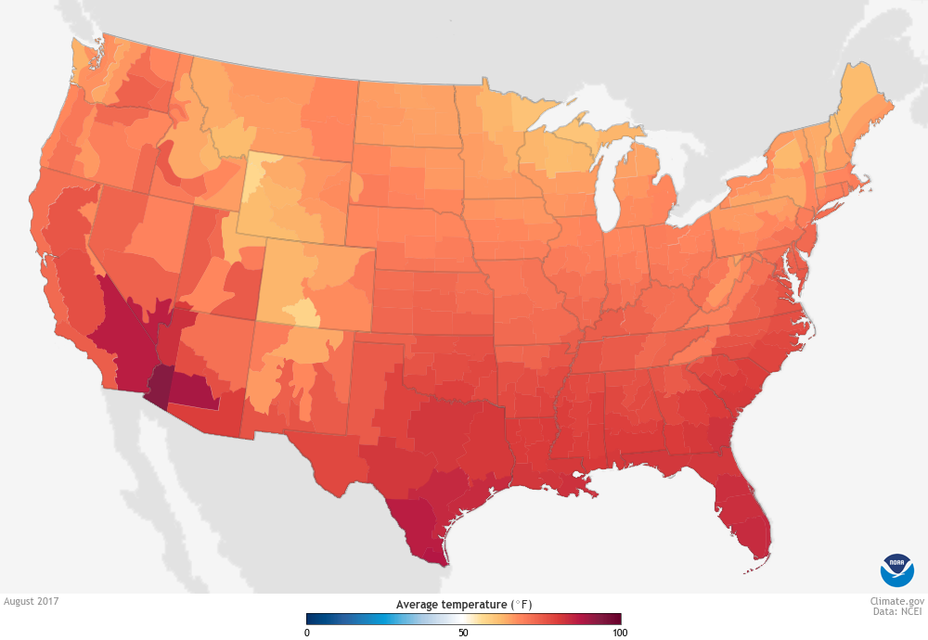
This diagram is showing the heat in the U.S. in August 2017 and it is interesting to see the severe heat affecting the country.
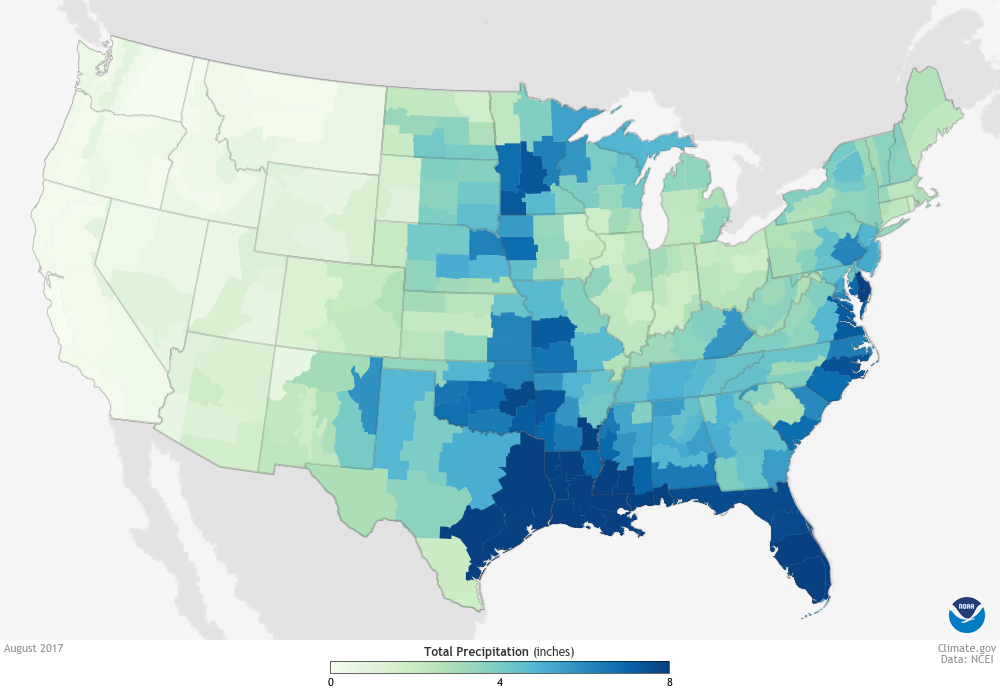
This diagram shows the precipitation of August 2017 showing the effects of the Hurricane and flooding. I chose this to see the data that would be shown with the crazy amount of hurricanes happening.
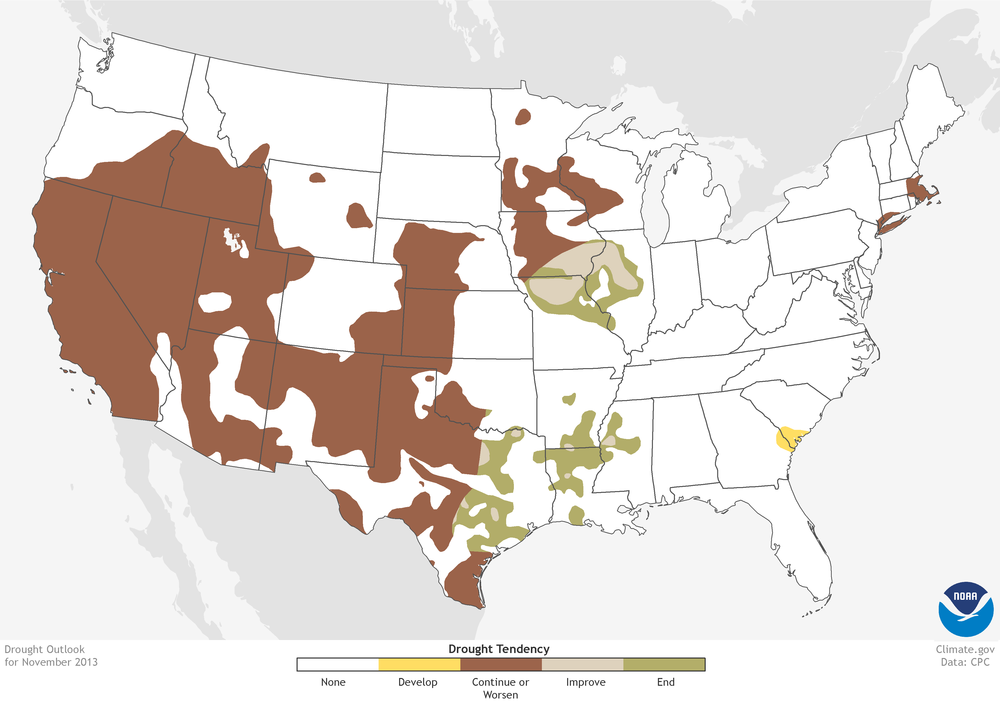
The map shows the levels of how intense the drought is across the U.S. Mostly in the west coast, the drought during 2013 was most shown in a large area of the country.
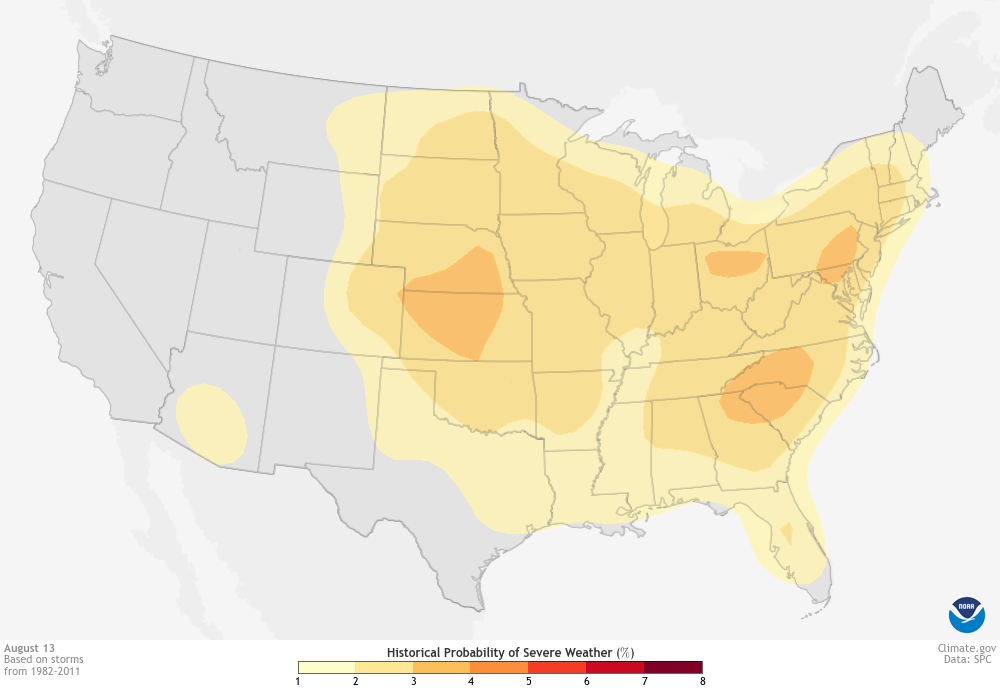
This diagram shows the severity of storms across the U.S. As the drought was a larger issue in the West, storms and wet weather can be more severe on the East coast.
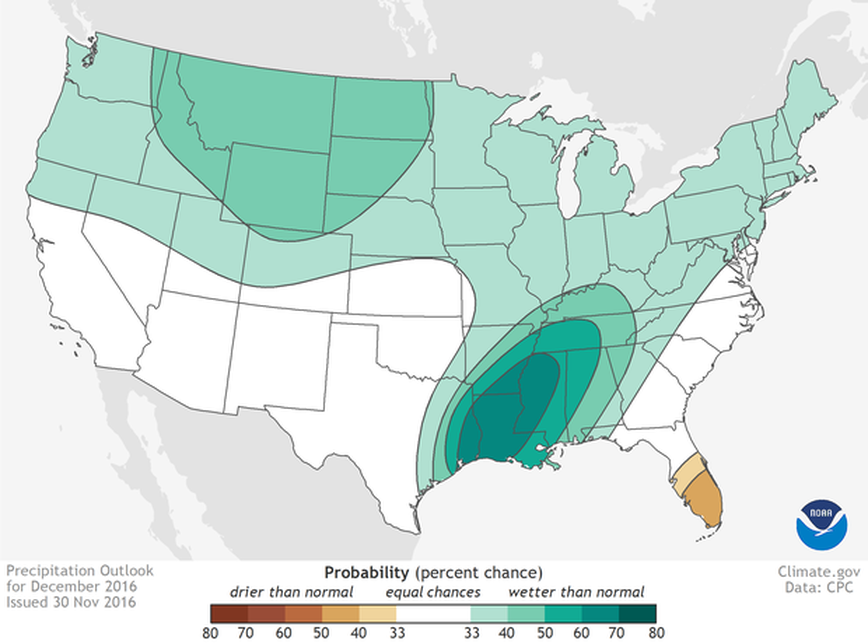
This diagram shows the outlook on rain throughout the united states for December 2016. There was much more than normal and it shows how there wasn't really much in California.
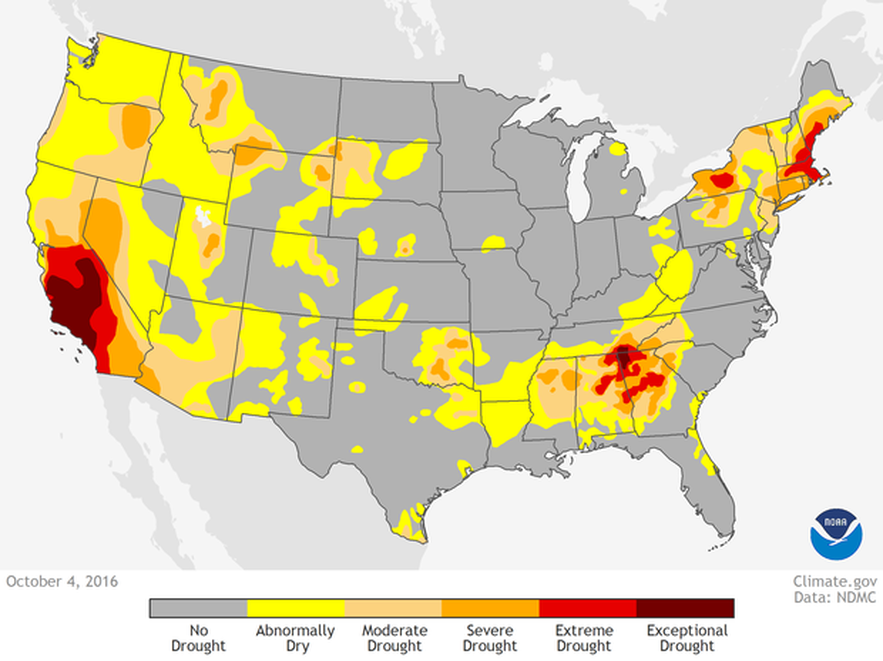
This map of the united states shows how severe was the several droughts in the country. A lot of spots had dry periods of time, but the drought that had hit California for years is clearly shown and thankfully has gone down since fall 2016.
Population Pyramids
8/31/17
The population in LA is increasing at a certain point because most young people move to LA for college or to pursue careers in some type of media.
San Diego is mostly stable and has a lot of young adults most likely due to the several colleges there.
Monterey's population is expanding slowly because there is a similar amount of people who are older and younger, most likely there is a lot of families in Monterey.
New York City's population has an abundance of young adults which could be due to the colleges or people wanting to live in a city like New York.
Long Beach's population is fairly stable and has a lot of people in several different age groups.
Delhi's population is expanding rapidly and has much more young than older people. Possibly due to the fact that there are a lot of families there and the city is growing little by little.
Turlock has a stable population and has a similar amount of adults than there are younger people.
